It’s official: Donald Trump has become only the fourth president in U.S. history to be the subject of a House impeachment inquiry.
I won’t say much on this, as the details of the inquiry are still unfolding. Plus, it’s an extremely divisive topic. Less than half of Americans support Trump’s impeachment, even after the news broke of his call with Ukrainian president Volodymyr Zelensky.
I will say one thing. If history is any guide, it’s highly unlikely that Trump will be convicted of any impeachment charges, especially with Republicans in control of the Senate. The only two presidents who have ever faced such charges, Andrew Johnson and Bill Clinton, were both acquitted. Richard Nixon, as you know, resigned before articles of impeachment could be drawn up.
I don’t believe investors have too much to worry about in the short term, despite Trump’s warning that “markets would crash” if he were impeached. “Do you think it was luck that got us to the Best Market and Economy in our history,” he tweeted this week. “It wasn’t!”
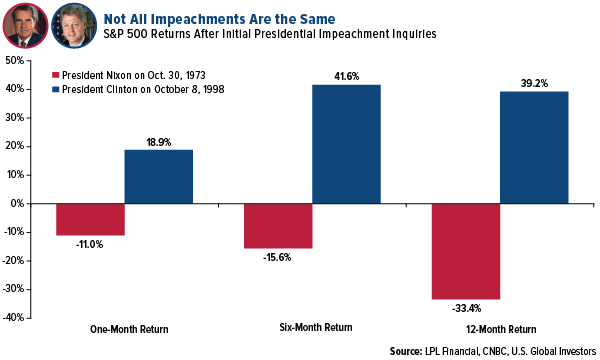
The sample size is small, but history shows that impeachments have had minimal impact on markets, and outcomes have been inconsistent. Stocks slid in the months following the start of Nixon’s impeachment inquiry, but far more important factors were at play, including the collapse of the Bretton Woods monetary system, the 1973 oil crisis and the start of the 1970s recession. In Clinton’s case, stocks ended up nearly 40 percent 12 months after the House announced its plans to impeach. But again, context matters. The U.S. economy was strong in the late 90s, and we were at the tail end of one of the longest equity bull markets in history.
The scenario today looks very much the same. The U.S. economy—though it may be showing some cracks—is still going strong. Stocks have so far shrugged off threats of impeachment. Going forward, I would place the blame of any potential market weakness on other factors, from the global economic slowdown to ongoing trade tensions between the U.S. and China.
Germany on the Cusp of Recession
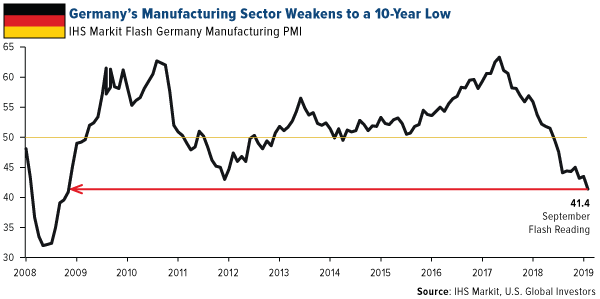
Indeed, if we look overseas, there’s much more that could rattle markets than U.S. political theater. Germany, for instance, may be on the cusp of recession, if it has not already entered one. The preliminary purchasing manager’s index (PMI) for September shows that the manufacturing sector in the world’s fourth largest economy is contracting at its fastest pace since the depths of the global financial crisis a decade ago. The flash PMI registered 41.4, an alarming 123-month low.
“The manufacturing numbers are simply awful,” commented Phil Smith, principal economist at IHS Markit, which produces the monthly report. “All the uncertainty around trade wars, the outlook for the car industry and Brexit are paralyzing order books.”
Car sales have been slowing across Europe for months now, as I’ve written about before. In August they were down a whopping 8.4 percent year-over-year, according to the European Automobile Manufacturers Association (ACEA). This has been a drag on Germany’s important automotive manufacturing industry, Europe’s largest and the world’s fourth largest by production.
Suppliers are feeling the pain as well. Continental AG, the Hanover, Germany-based manufacturer of auto parts, said this week that as many as 20,000 jobs were at risk over the next decade as plants will be closed not only in Germany but also Italy and the U.S.
Nervous investors have run for cover in the German bond market, where yields across the entire yield curve are currently trading in negative territory.
Helicopter Money Ahead?
A record $17 trillion in global debt now carries a negative yield, which is equivalent to about 20 percent of world GDP, according to a recent report by the Bank for International Settlements (BIS). The bank notes that the growing acceptance of negative yields has become “vaguely troubling.”
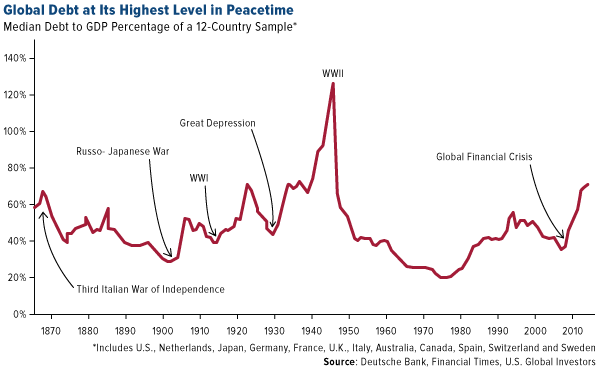
Just as troubling is the expanding level of global debt, which is now the highest it’s ever been in peacetime, according to Deutsche Bank’s recent analysis of 12 major economies. These dozen economies collectively have an average debt-to-GDP of 70 percent, the highest level in 150 years outside of a world war.
Jim Reid, the report’s lead author, warns that we may see central banks continue the sort of unconventional market interventions that have propelled record levels of borrowing in the first place.
“The multi-trillion dollar question is whether governments can successfully and consistently issue the holy grail of funding—zero-coupon perpetual bonds. If they can do that, spend the money, and central banks buy the bonds, then that is pure helicopter money,” Reid writes.
In its simplest terms, “helicopter money” refers to a rapid surge in money-printing, the hope being that it will spur economic output.
An inevitable consequence to this, of course, is runaway inflation. See: Weimar Germany, Zimbabwe and, more recently, Venezuela.
WGC: Gold Is Still Under-Represented
I see gold as a solution to many of the issues I’ve laid out, whether it’s recessionary spillover from Germany, high debt levels or helicopter money.
I’m not alone in thinking this. In a September report, the World Gold Council (WGC) calls the yellow metal “the most effective commodity investment,” adding that “allocations of 2 percent to 10 percent in a typical pension portfolio have provided better risk-adjusted returns than those with broad-based commodity allocations.”
However, the WGC says, gold is under-represented in most commodity indices, meaning investors are underexposed.
“Investors who access commodities via a broad-based index often assume they have an appropriate allocation to gold. In fact, most broad-based commodity indices have a very small allocation,” the WGC analysts write.
Consider the S&P GSCI, which tracks 24 commodities. West Texas Intermediate (WTI) oil and Brent oil make up nearly half of the index with a combined weighting of 45 percent. Gold, meanwhile, represents only 3.73 percent of the index.
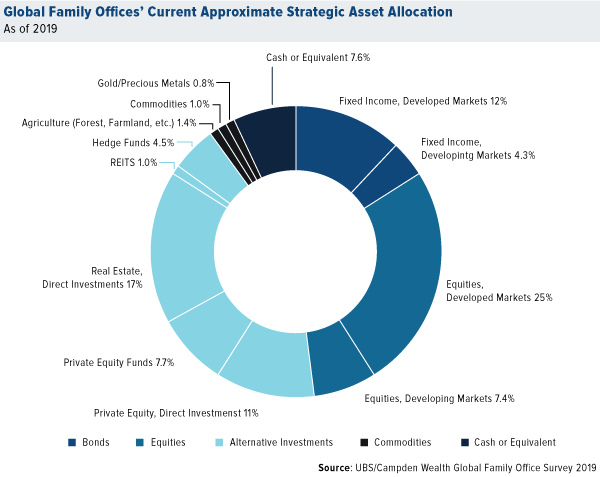
This underexposure can be seen in a recent review of global family offices’ asset allocations. UBS’ Global Family Office Report 2019, released this week, shows that gold represents as little as 0.8 percent of portfolios on average. Equities in developed markets are the top position, representing a full quarter of portfolios, but some managers say they are trimming their exposure in preparation for a potential recession. A full 55 percent of family offices believe a recession will make landfall by 2020, according to the study.
The good news is that, of the 360 family offices surveyed—which collectively manage approximately $5.9 trillion—17 percent said they were planning to increase their gold position in 2020. More than three quarters said they were keeping it the same. Only 5.3 percent said they would be decreasing their exposure.
Increasing their gold exposure, I believe, would be rational and prudent at this time. As I told Kitco News’ Daniela Cambone at last week’s Denver Gold Forum (DGF), the longer yields stay negative around the world, the better the chances are of gold rocketing up to $10,000 an ounce. You can watch the entire interview by clicking here.
Congratulations to the U.S. Global Marketing Team!
On a final note, I wish to congratulate our marketing team for the recognition they received this week from the Investment Management Education Alliance (IMEA), which promotes knowledge-sharing and investor education among marketers who work in the financial industry.
At this year’s event in Chicago, our team picked up two STAR awards, for Best Newsletter and Best Product Education Campaign, as well as special recognition for its community volunteering. U.S. Global now has 88 STAR awards to its name.
These accolades would not be possible without you, our readers and subscribers, so thank you!
If you’re still not subscribed to my CEO blog, Frank Talk, you can do so by clicking here.
Until next week, happy investing!
Gold Market
This week spot gold closed at $1,497.05, down $19.85 per ounce, or 1.31 percent. Gold stocks, as measured by the NYSE Arca Gold Miners Index, ended the week lower by 3.45 percent. The S&P/TSX Venture Index came in off 3.53 percent. The U.S. Trade-Weighted Dollar rose 0.61 percent.
| Date | Event | Survey | Actual | Prior |
|---|---|---|---|---|
| Sep-24 | Conf. Board Consumer Confidence | 133.0 | 125.1 | 134.2 |
| Sep-25 | New Home Sales | 659k | 713k | 666k |
| Sep-26 | Hong Kong Exports YoY | -7.4% | -6.3% | -5.7% |
| Sep-26 | GDP Annualized QoQ | 2.0% | 2.0% | 2.0% |
| Sep-26 | Initial Jobless Claims | 212k | 213k | 210k |
| Sep-27 | Durable Goods Orders | -1.1% | 0.2% | -2.0% |
| Sep-29 | Caixin China PMI Mfg | 50.2 | — | 50.4 |
| Sep-30 | Germany CPI YoY | 1.3% | — | 1.4% |
| Oct-1 | Eurozone CPI Core YoY | 1.0% | — | 0.9% |
| Oct-1 | ISM Manufacturing | 50.3 | — | 49.1 |
| Oct-2 | ADP Employment Change | 140k | — | 195k |
| Oct-3 | Initial Jobless Claims | 215k | — | 213k |
| Oct-3 | Durable Goods Orders | — | — | 0.2% |
| Oct-4 | Change in Nonfarm Payrolls | 140k | — | 130k |
Strengths
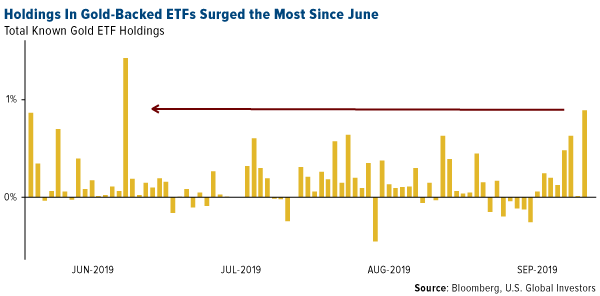
- The best performing metal this week was palladium, up 2.57 percent as hedge funds increased their bullish positioning to an eight-week high. Gold traders and analysts were split between bullish and bearish on the yellow metal this week in the Bloomberg survey despite the metal’s price swings. On Monday, ETFs added 498,162 troy ounces of gold to their holdings, the most in three months, according to Bloomberg data. Then on Thursday, ETFs added another 130,610 troy ounces of gold, marking the ninth straight day of inflows. Hedge funds boosted their bullish positions in gold to the most bullish on record with data going back to 2006.
- Turkey’s central bank gold holdings rose $903 million from the previous week to bring total holdings to $25.9 billion. The nation’s reserves are up a whopping 45 percent year over year.
- Even as gold prices had a very bad day on Wednesday, falling 1.8 percent, demand for gold-backed ETFs spiked. Holdings jumped the most since June. Bloomberg writes that this suggests some investors have been waiting for a pullback in order to buy the dip. Where is all this money coming from? Perhaps from divestment in the S&P 500. Bloomberg reports that the SPDR S&P 500 ETF Trust lost $8.7 billion to withdrawals last week and that the SPDR Gold Shares ETF saw $950 million in inflows, the most in three months.
Weaknesses
- The worst performing metal this week was silver, down 2.61 percent as hedge funds cut their net-long position to a five-week low. In negative economic news, U.S. home price gains in 20 cities decelerated in July for a 16th straight month. The S&P CoreLogic Case-Shiller index of property values increased 2 percent from a year earlier, which is the slowest since August 2012. U.S. consumer confidence saw the biggest drop since the start of 2019, falling to 125.1. This demonstrates that expectations for the economy are worsening, which poses a risk to household spending.
- Sibanye Gold Ltd. announced that it plans to cut 5,270 jobs at its Marikana platinum mines in South Africa as deadlocked wage negotiations with workers brought a strike closer, reports Bloomberg. The company is restructuring operations that it acquired when purchasing Lonmin Plc earlier this year that made it the world’s biggest platinum miner.
- Discounts on gold in India have widened significantly due to muted retail demand and higher unofficial imports, according to the World Gold Council Market Intelligence Group. The gold discount was $28 in July and then widened to $55 an ounce in August. Gold demand out of India, the world’s second largest consumer, has weakened due to higher prices but could rise in the coming month as Diwali approaches.
Opportunities
- In a stock deal implying equity value of around C$338 million, Osisko Gold Royalties has entered into a definitive agreement to buy the remainder of Barkerville Gold Mines, reports Bloomberg. According to the article, the purchase is a premium of 26 percent over the Barkerville September 20 closing price. On the topic of gold names, Citigroup says that the latest signs are “strongly suggesting” that uptrends in precious metals are resuming after consolidating for the past few weeks. If you recall, earlier in the month the group said gold could rally to a record above $2,000 an ounce in the next two years. Similarly, Overseas China Banking Corp. agrees that gold should be supported in the short term, and could advance toward $1,600 an ounce.
- A deficit in palladium could widen amid a lack of mine investment, reports Bloomberg. That is according to MMC Norilsk Nickel, which controls around 40 percent of global palladium output. The Russian company explains that the supply shortfall for palladium will be 600,000 ounces this year due to tougher environmental regulations underpinning demand. Palladium set another record on Wednesday after gaining over 30 percent this year, Bloomberg continues.
- Conviction in gold’s uptrend is strengthening, according to UBS’s Global Precious Metals Comment for the week. As Joni Teves writes, as gold gains further upward momentum, UBS believes other areas in the market can become more active and support the next leg higher. “Participation out of China, the private wealth community, and retail investors has scope to pick up ahead, granted the supportive macro narrative remains intact,” she continues. Bloomberg ads in another article this week, which due to insufficient exploration spending, gold reserves have depleted significantly. This alone looks to be enough supply-side impetus to perk up the yellow metal.
Threats
- According to AGF Investments, investors should be more concerned about the increasing prospects of Elizabeth Warren as president of the U.S. than the Donald Trump-Ukraine phone call scandal. The firm says that the Ukraine controversy is unlikely to affect stock markets and that President Trump should instead be attacking Warren as the main competition. According to Jefferies LLC, a 2020 election that pits Trump against Warren could finally crack the U.S. dollar’s multiyear rise by creating a massive spend fest, reports Bloomberg. Brad Bechtel, global head of foreign-exchange, says, “Warren and Trump’s tone would be different but the end result would be the same, massive blowouts of the U.S. government budget.”
- Bloomberg reports that the repo market could be heading for trouble on Monday even as the market calmed this week. Last week the overnight repo rate soared to a record high of 10 percent amid a funding crunch that drew scrutiny to the size of the Fed’s balance sheet, writes Alexandra Harris. Thomas Cook collapsed this week, but not everyone was a loser. Hedge funds have been betting that some companies will fail by buying credit-default swaps. Bloomberg reports that more companies are set to follow Thomas Cook’s path as Europe’s economy slows and a growing number of companies are under stress.
- The Minerals Council of Australia (MCA) has warned that gold companies could face mine closures if the Victorian government moves ahead with a 2.75 percent royalty on gold production. Australia is one of the largest miners of the metal. The MCA says that the projected $16 million in revenue the government would see from the royalty pales in comparison to the $300 million spent by Victorian gold mines in 2018 on wages, goods and services, taxes and community grants, the Financial Times reports.
Please note: The articles listed above contain historical material. The data provided was current at the time of publication. For current information regarding any of the funds mentioned in these presentations, please visit the appropriate fund performance page.
U.S. Global Investors, Inc. is an investment adviser registered with the Securities and Exchange Commission (“SEC”). This does not mean that we are sponsored, recommended, or approved by the SEC, or that our abilities or qualifications in any respect have been passed upon by the SEC or any officer of the SEC.
This commentary should not be considered a solicitation or offering of any investment product.
Certain materials in this commentary may contain dated information. The information provided was current at the time of publication.
Some links above may be directed to third-party websites. U.S. Global Investors does not endorse all information supplied by these websites and is not responsible for their content.
Holdings may change daily. Holdings are reported as of the most recent quarter-end. The following securities mentioned in the article were held by one or more accounts managed by U.S. Global Investors as of (06/30/2019):
Ecopetrol SA
Occidental Petroleum Corp
Turkiye Garanti Bank AS
Akbank T.A.S.
SPDR S&P 500 ETF Trust
SPDR Gold Shares ETF
Osisko Gold Royalties Ltd
Barkerville Gold Mines Ltd
MMC Norilsk Nickel PJSC
*The above-mentioned indices are not total returns. These returns reflect simple appreciation only and do not reflect dividend reinvestment. The Dow Jones Industrial Average is a price-weighted average of 30 blue chip stocks that are generally leaders in their industry. The S&P 500 Stock Index is a widely recognized capitalization-weighted index of 500 common stock prices in U.S. companies. The Nasdaq Composite Index is a capitalization-weighted index of all Nasdaq National Market and SmallCap stocks. The Russell 2000 Index® is a U.S. equity index measuring the performance of the 2,000 smallest companies in the Russell 3000®, a widely recognized small-cap index. The Hang Seng Composite Index is a market capitalization-weighted index that comprises the top 200 companies listed on Stock Exchange of Hong Kong, based on average market cap for the 12 months. The Taiwan Stock Exchange Index is a capitalization-weighted index of all listed common shares traded on the Taiwan Stock Exchange. The Korea Stock Price Index is a capitalization-weighted index of all common shares and preferred shares on the Korean Stock Exchanges. The Philadelphia Stock Exchange Gold and Silver Index (XAU) is a capitalization-weighted index that includes the leading companies involved in the mining of gold and silver. The U.S. Trade Weighted Dollar Index provides a general indication of the international value of the U.S. dollar. The S&P/TSX Canadian Gold Capped Sector Index is a modified capitalization-weighted index, whose equity weights are capped 25 percent and index constituents are derived from a subset stock pool of S&P/TSX Composite Index stocks. The S&P 500 Energy Index is a capitalization-weighted index that tracks the companies in the energy sector as a subset of the S&P 500. The S&P 500 Materials Index is a capitalization-weighted index that tracks the companies in the material sector as a subset of the S&P 500. The S&P 500 Financials Index is a capitalization-weighted index. The index was developed with a base level of 10 for the 1941-43 base period. The S&P 500 Industrials Index is a Materials Index is a capitalization-weighted index that tracks the companies in the industrial sector as a subset of the S&P 500. The S&P 500 Consumer Discretionary Index is a capitalization-weighted index that tracks the companies in the consumer discretionary sector as a subset of the S&P 500. The S&P 500 Information Technology Index is a capitalization-weighted index that tracks the companies in the information technology sector as a subset of the S&P 500. The S&P 500 Consumer Staples Index is a Materials Index is a capitalization-weighted index that tracks the companies in the consumer staples sector as a subset of the S&P 500. The S&P 500 Utilities Index is a capitalization-weighted index that tracks the companies in the utilities sector as a subset of the S&P 500. The S&P 500 Healthcare Index is a capitalization-weighted index that tracks the companies in the healthcare sector as a subset of the S&P 500. The S&P 500 Telecom Index is a Materials Index is a capitalization-weighted index that tracks the companies in the telecom sector as a subset of the S&P 500. The NYSE Arca Gold Miners Index is a modified market capitalization weighted index comprised of publicly traded companies involved primarily in the mining for gold and silver. The Consumer Price Index (CPI) is one of the most widely recognized price measures for tracking the price of a market basket of goods and services purchased by individuals. The weights of components are based on consumer spending patterns. The Purchasing Manager’s Index is an indicator of the economic health of the manufacturing sector. The PMI index is based on five major indicators: new orders, inventory levels, production, supplier deliveries and the employment environment. The S&P/TSX Venture Composite Index is a broad market indicator for the Canadian venture capital market. The index is market capitalization weighted and, at its inception, included 531 companies. A quarterly revision process is used to remove companies that comprise less than 0.05% of the weight of the index, and add companies whose weight, when included, will be greater than 0.05% of the index. Gross domestic product (GDP) is the monetary value of all the finished goods and services produced within a country’s borders in a specific time period, though GDP is usually calculated on an annual basis. It includes all of private and public consumption, government outlays, investments and exports less imports that occur within a defined territory.
The S&P/Case-Shiller Index tracks changes in home prices throughout the United States by following price movements in the value of homes in 20 major metropolitan areas. The Conference Board index of leading economic indicators is an index published monthly by the Conference Board used to predict the direction of the economy’s movements in the months to come. The index is made up of 10 economic components, whose changes tend to precede changes in the overall economy. The IHS Markit / BME Germany Manufacturing PMI is compiled by IHS Markit from responses to questionnaires sent to purchasing managers in a panel of around 400 manufacturers. The panel is stratified by detailed sector and company workforce size, based on contributions to GDP. The widely tracked S&P GSCI is recognized as a leading measure of general price movements and inflation in the world economy. The index representing market beta is world-production weighted. It is designed to be investable by including the most liquid commodity futures, and provides diversification with low correlations to other asset classes. The NIFTY 50 index National Stock Exchange of India’s benchmark broad based stock market index for the Indian equity market. Sensex, otherwise known as the S&P BSE Sensex index, is the benchmark index of the Bombay Stock Exchange (BSE) in India. Sensex comprises 30 of the largest and most actively-traded stocks on the BSE, providing an accurate gauge of India’s economy. The SET Index is a Thai composite stock market index which is calculated from the prices of all common stocks (including unit trusts of property funds) on the main board of the Stock Exchange of Thailand (SET), except for stocks that have been suspended for more than one year. The Vietnam Stock Index or VN-Index is a capitalization-weighted index of all the companies listed on the Ho Chi Minh City Stock Exchange.


